Both the number and sales share of launches has dropped over the past 12 years
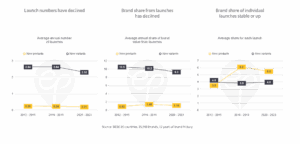 Brand launch intensity has declined
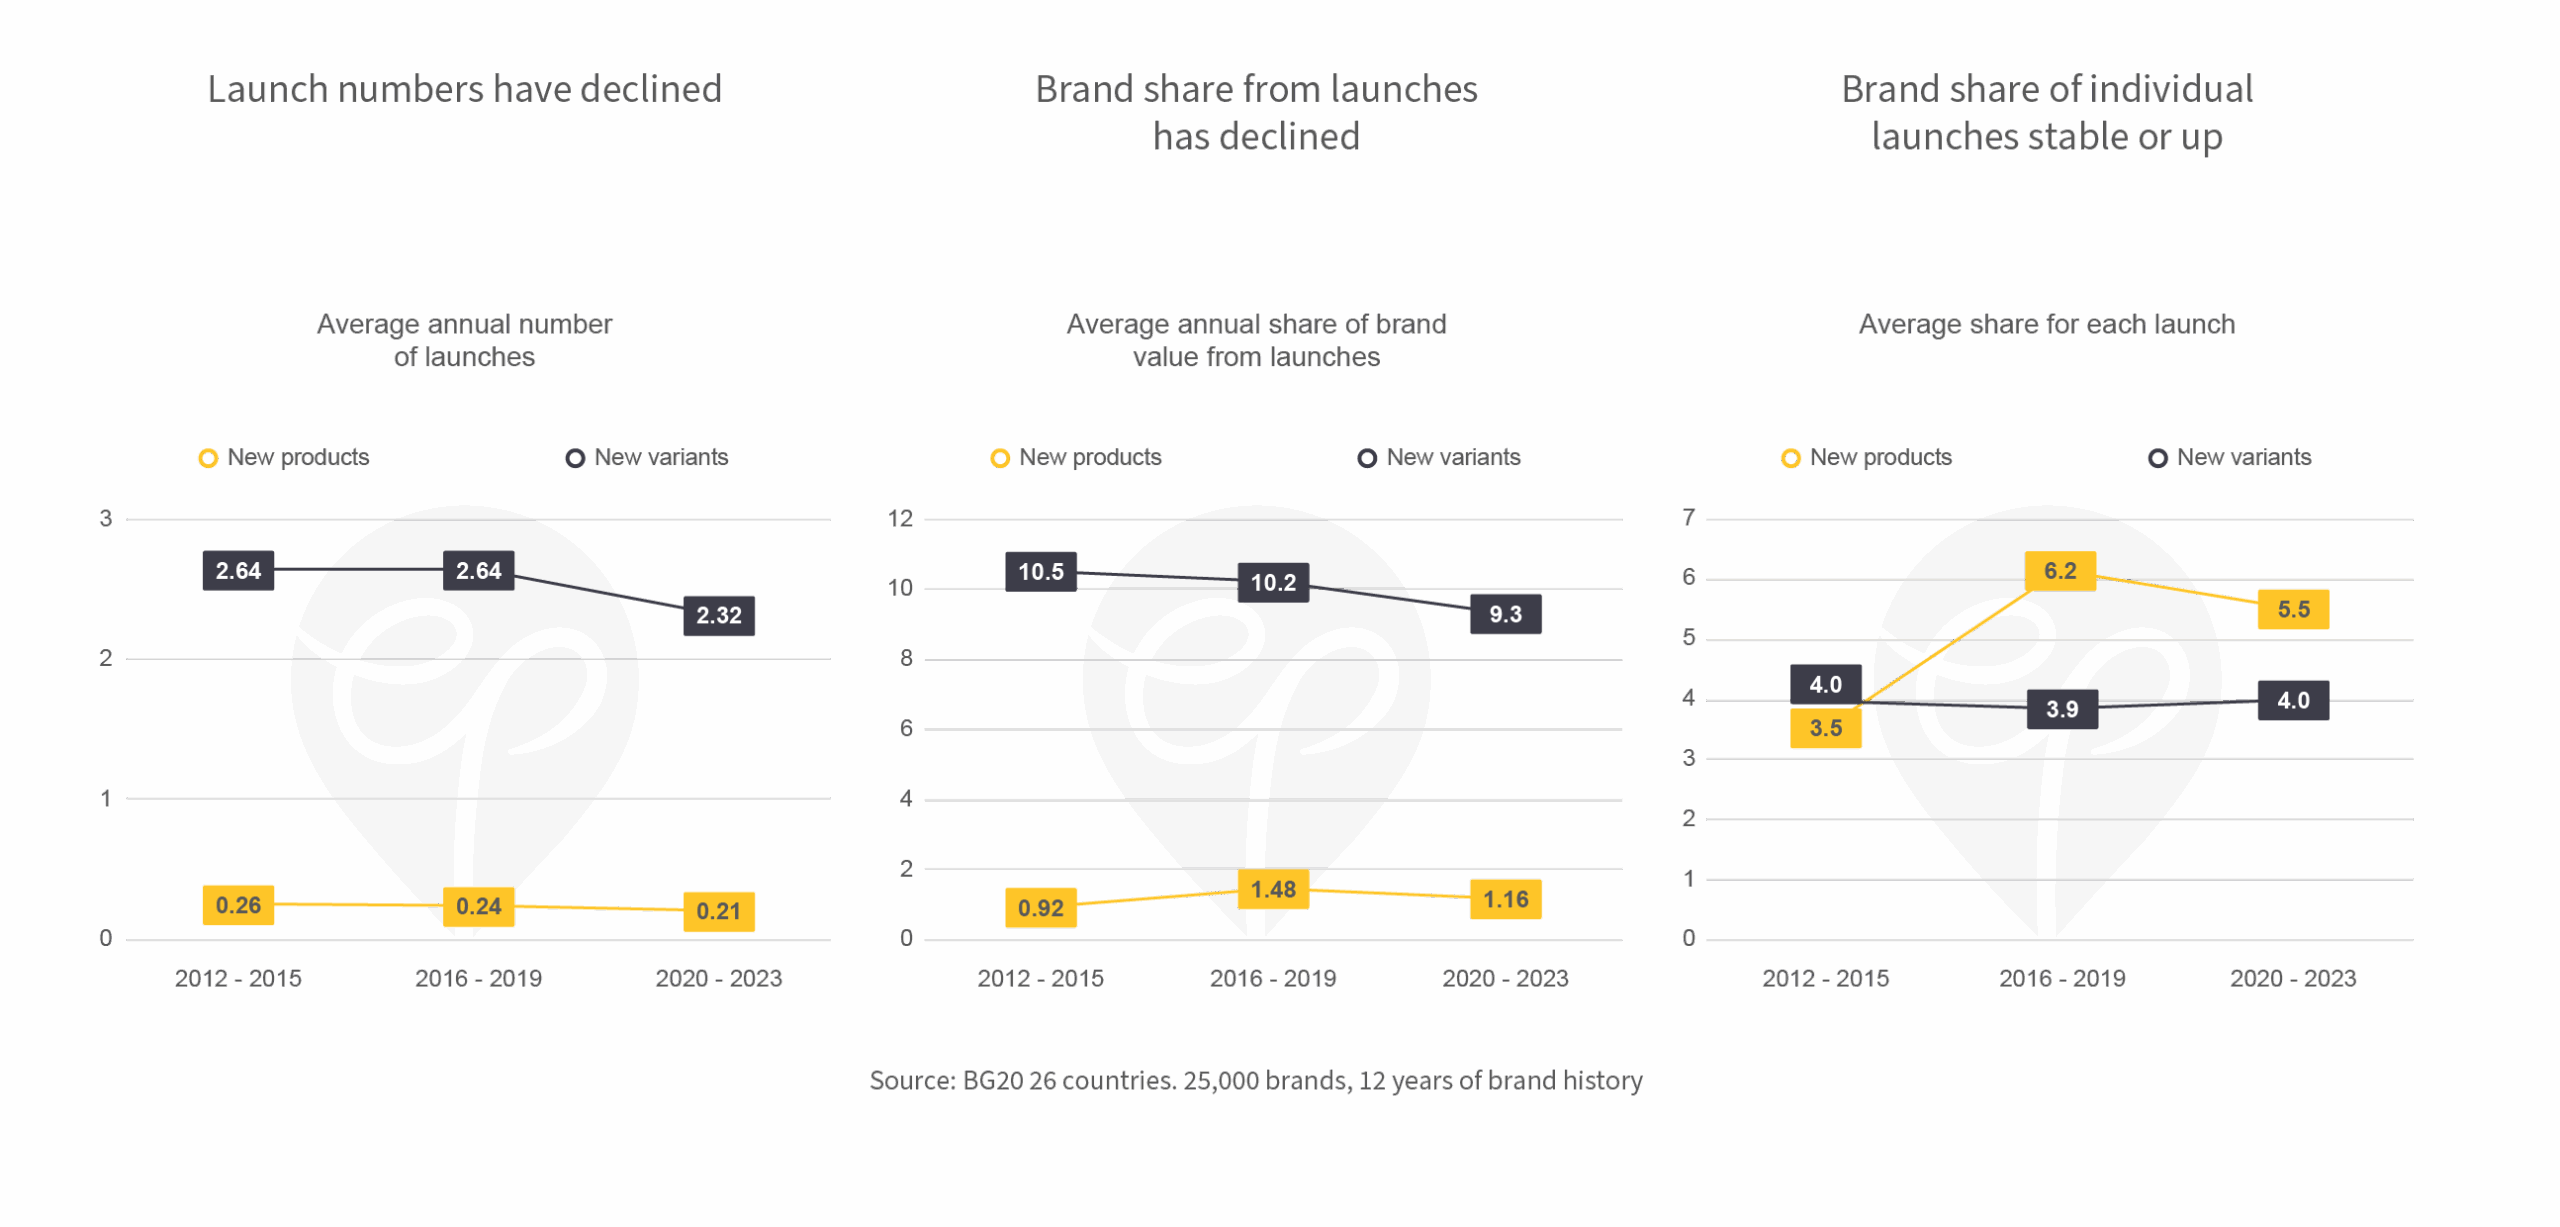
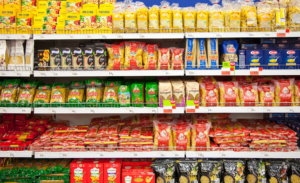
In our BG20 database we distinguish between new products (i.e. launches that carry a new brand or sub-brand) and new variants. The former are typically more distinct from the existing assortment in a category. We compare yearly launch numbers for three four-year periods: 2012-2015, 2016-2019 and 2020-2023. Both the number of new products and new variants has dropped: while the average Top 10 brand in our database has launched 2.9 SKUs in 2012-2015, this number is 2.53 in the latest four year period, a drop of 13%.
Brand share from launches has declined
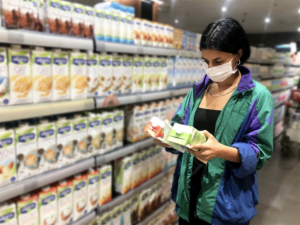
SKUs that are younger than 1 year typically account for around 10% of sales for the average Top 10 brands in our BG20 database. The average share of brand sales from launches was 11.4% in the 2012-2015 window and 10.5% in 2020-2023. While tough economic times pose challenges to any organization’s innovation pipeline, there is a lot of evidence that out-innovating competitors in recessions is particularly effective.
For more details, please see our own analyses and Steenkamp&Fang, 2011 for scientific evidence.
Brand share of individual launches stable or up
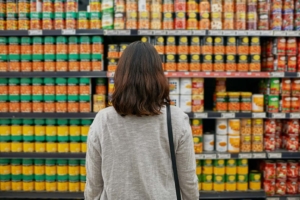
Since launch numbers have declined more than their sales share of the brand launching them, the average brand share commanded by each launch has increased a little, namely for new product launches. On average, new products are more successful than new variants (over the latest two four year periods) – a reflection of the importance attached to these launches by the brand owners: after all, they deserve to feature a new brand or sub-brand.