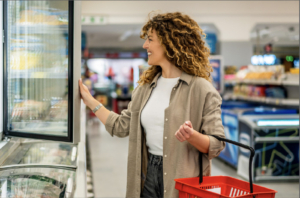
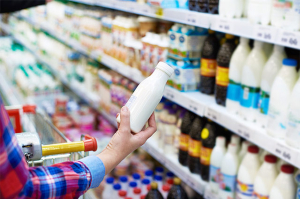
A closer look at purchase frequency: over time and across brand rank tiers
While the purchase frequency for categories, brands and PLs has dropped for a long time (essentially up to and during the pandemic), the subsequent crises (inflation, economic concerns) have reversed that trend
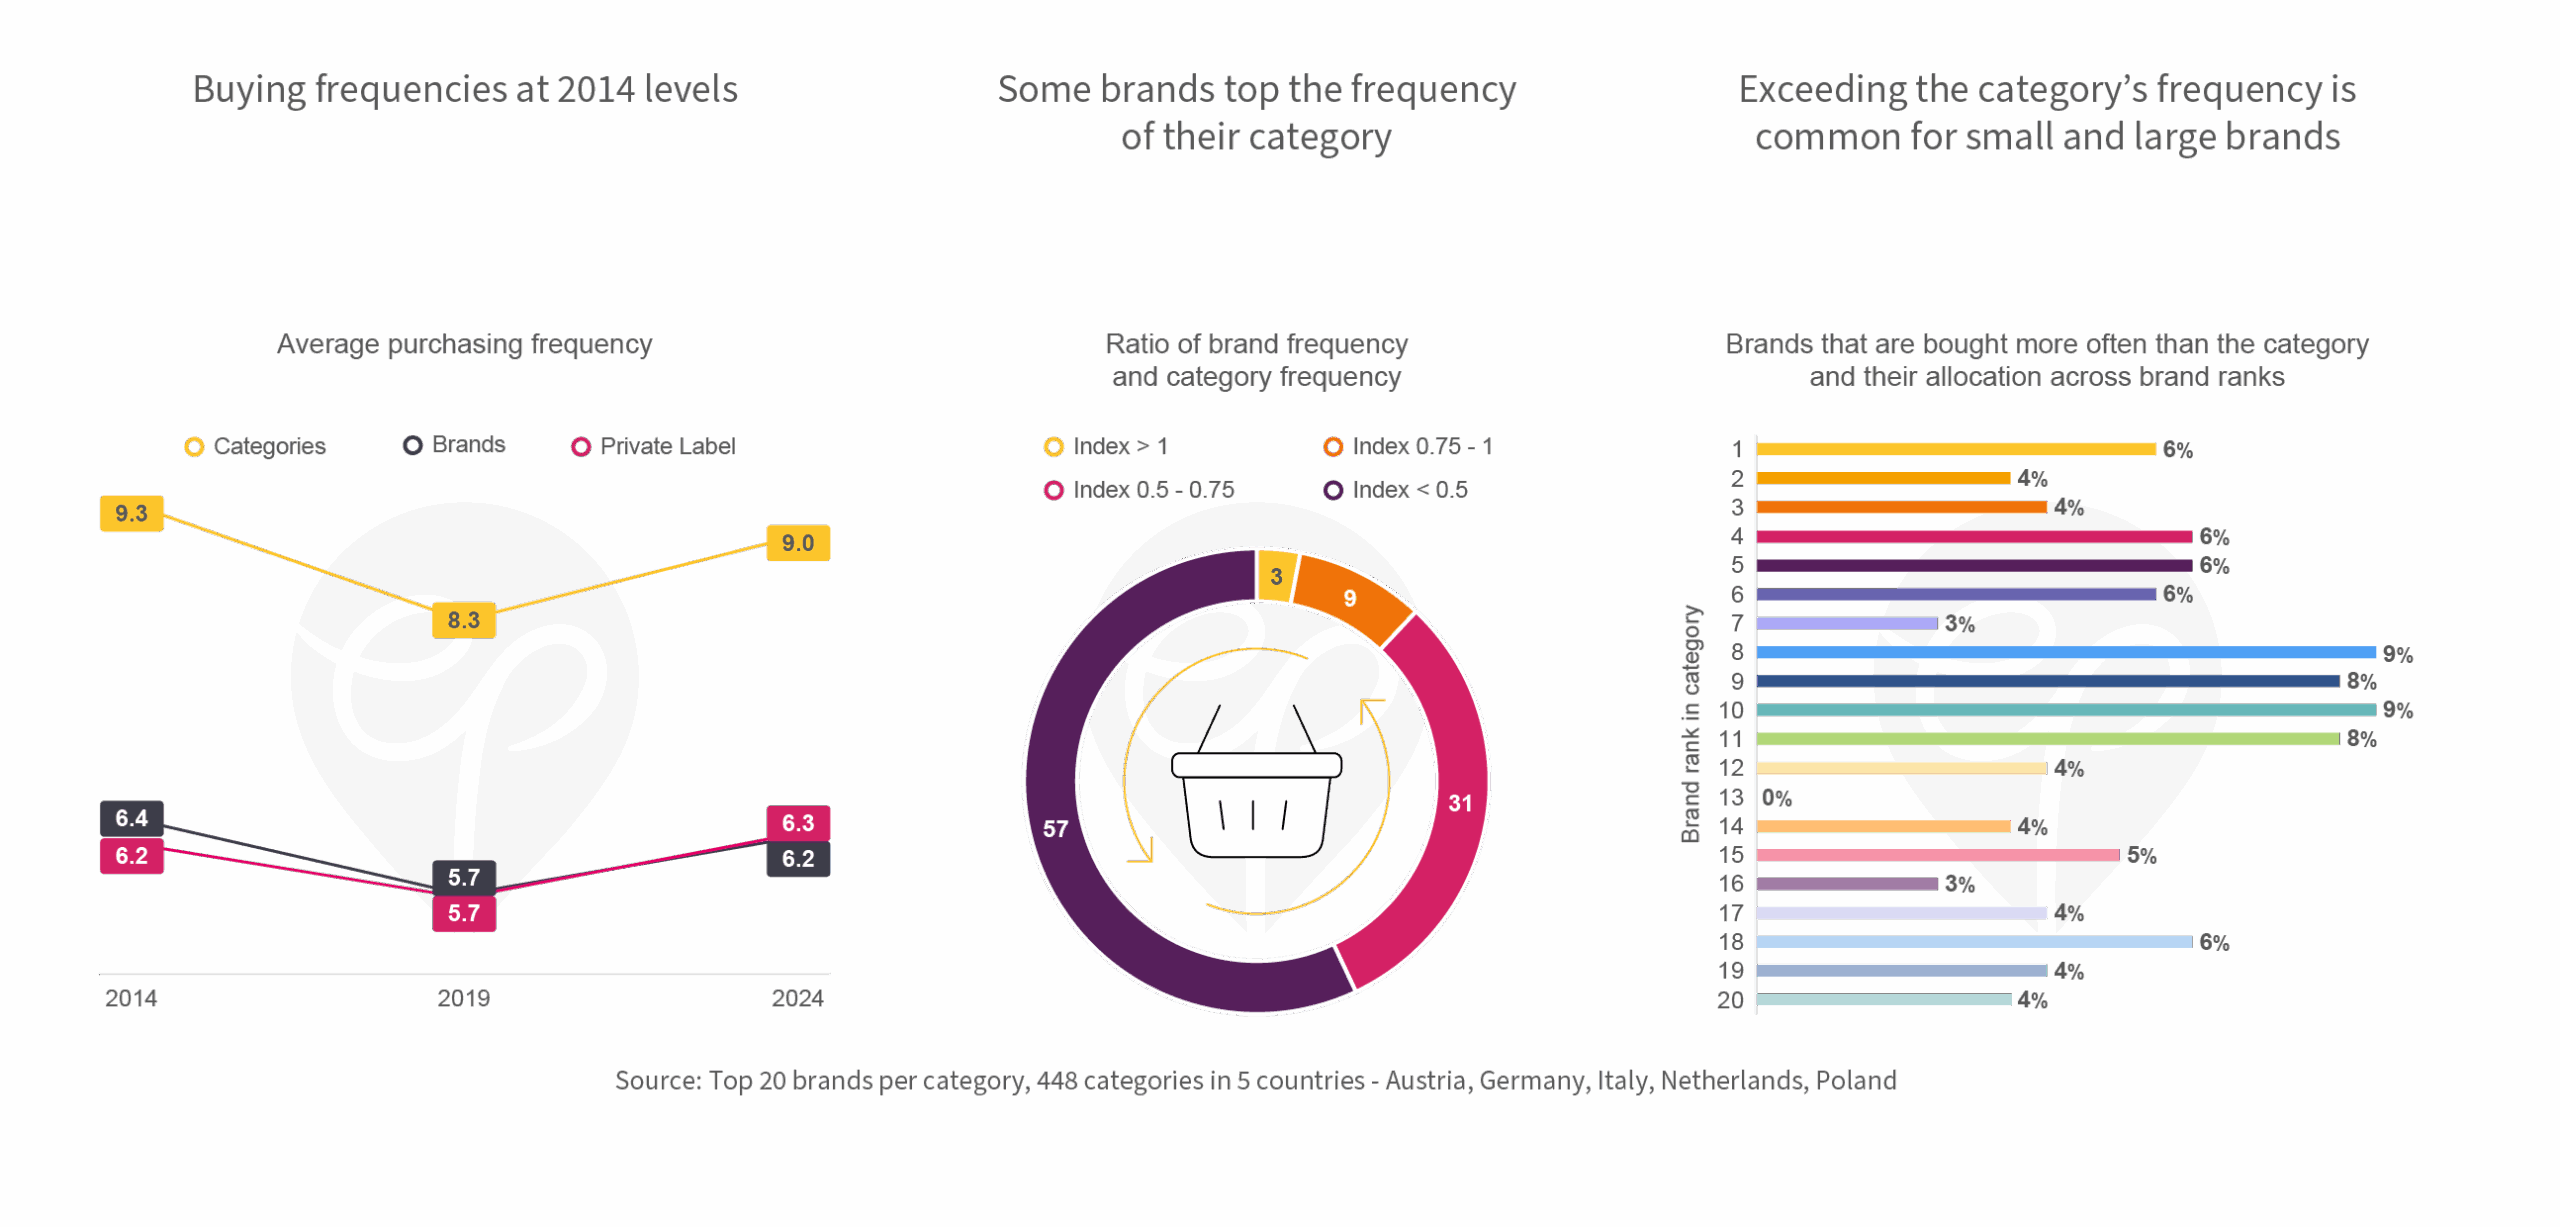
Buying frequencies at 2014 levels
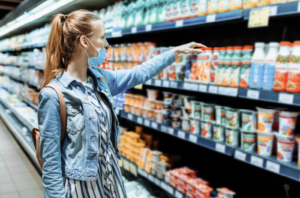
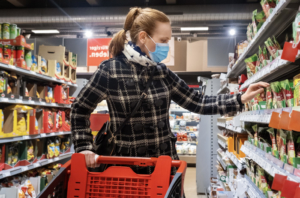
Buying frequency was declining until Covid – for the average category, the average brand and PLs overall. However, frequency numbers in 2024 are similar to what they were in 2014, with budgetary constraints a likely reason to shop more frequently again. Make sure that your portfolio of pack sizes responds to budgetary challenges some shoppers experience (small packs) or pre-empts competitive purchases where possible (large packs).
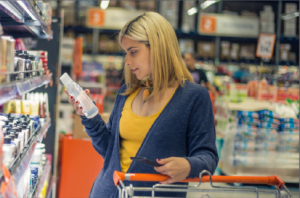
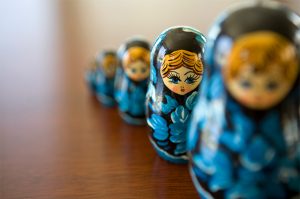
Some brands top the frequency of their category
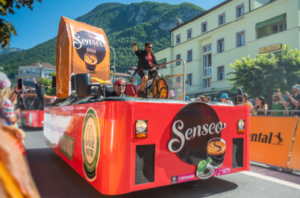
Given that most shoppers choose from a repertoire of brands it is not surprising that frequency of category purchasing typically exceeds the frequency that individual brands achieve. Nonetheless, some brands manage to be purchased more often or almost as often as the total category. Examples are brands with strong captive power (e.g. systems in coffee or shaving).
Exceeding the category’s frequency is common for small and large brands
We find such brands across all share ranks – both leading brands and smaller ones. The latter ones must therefore have particularly loyal buyers – sometimes high popularity in specific regions explains this phenomenon, or a very narrowly defined benefit appealing to a specific segment.