Penetration and its variation (1): how brand share and category frequency relate to the reach of a brand
The importance of buyer numbers for brand success is one, if not the most, recurring theme in this blog. This and next week’s edition take a closer look at factors linked to (and sometimes causing) differences in brand reach**.
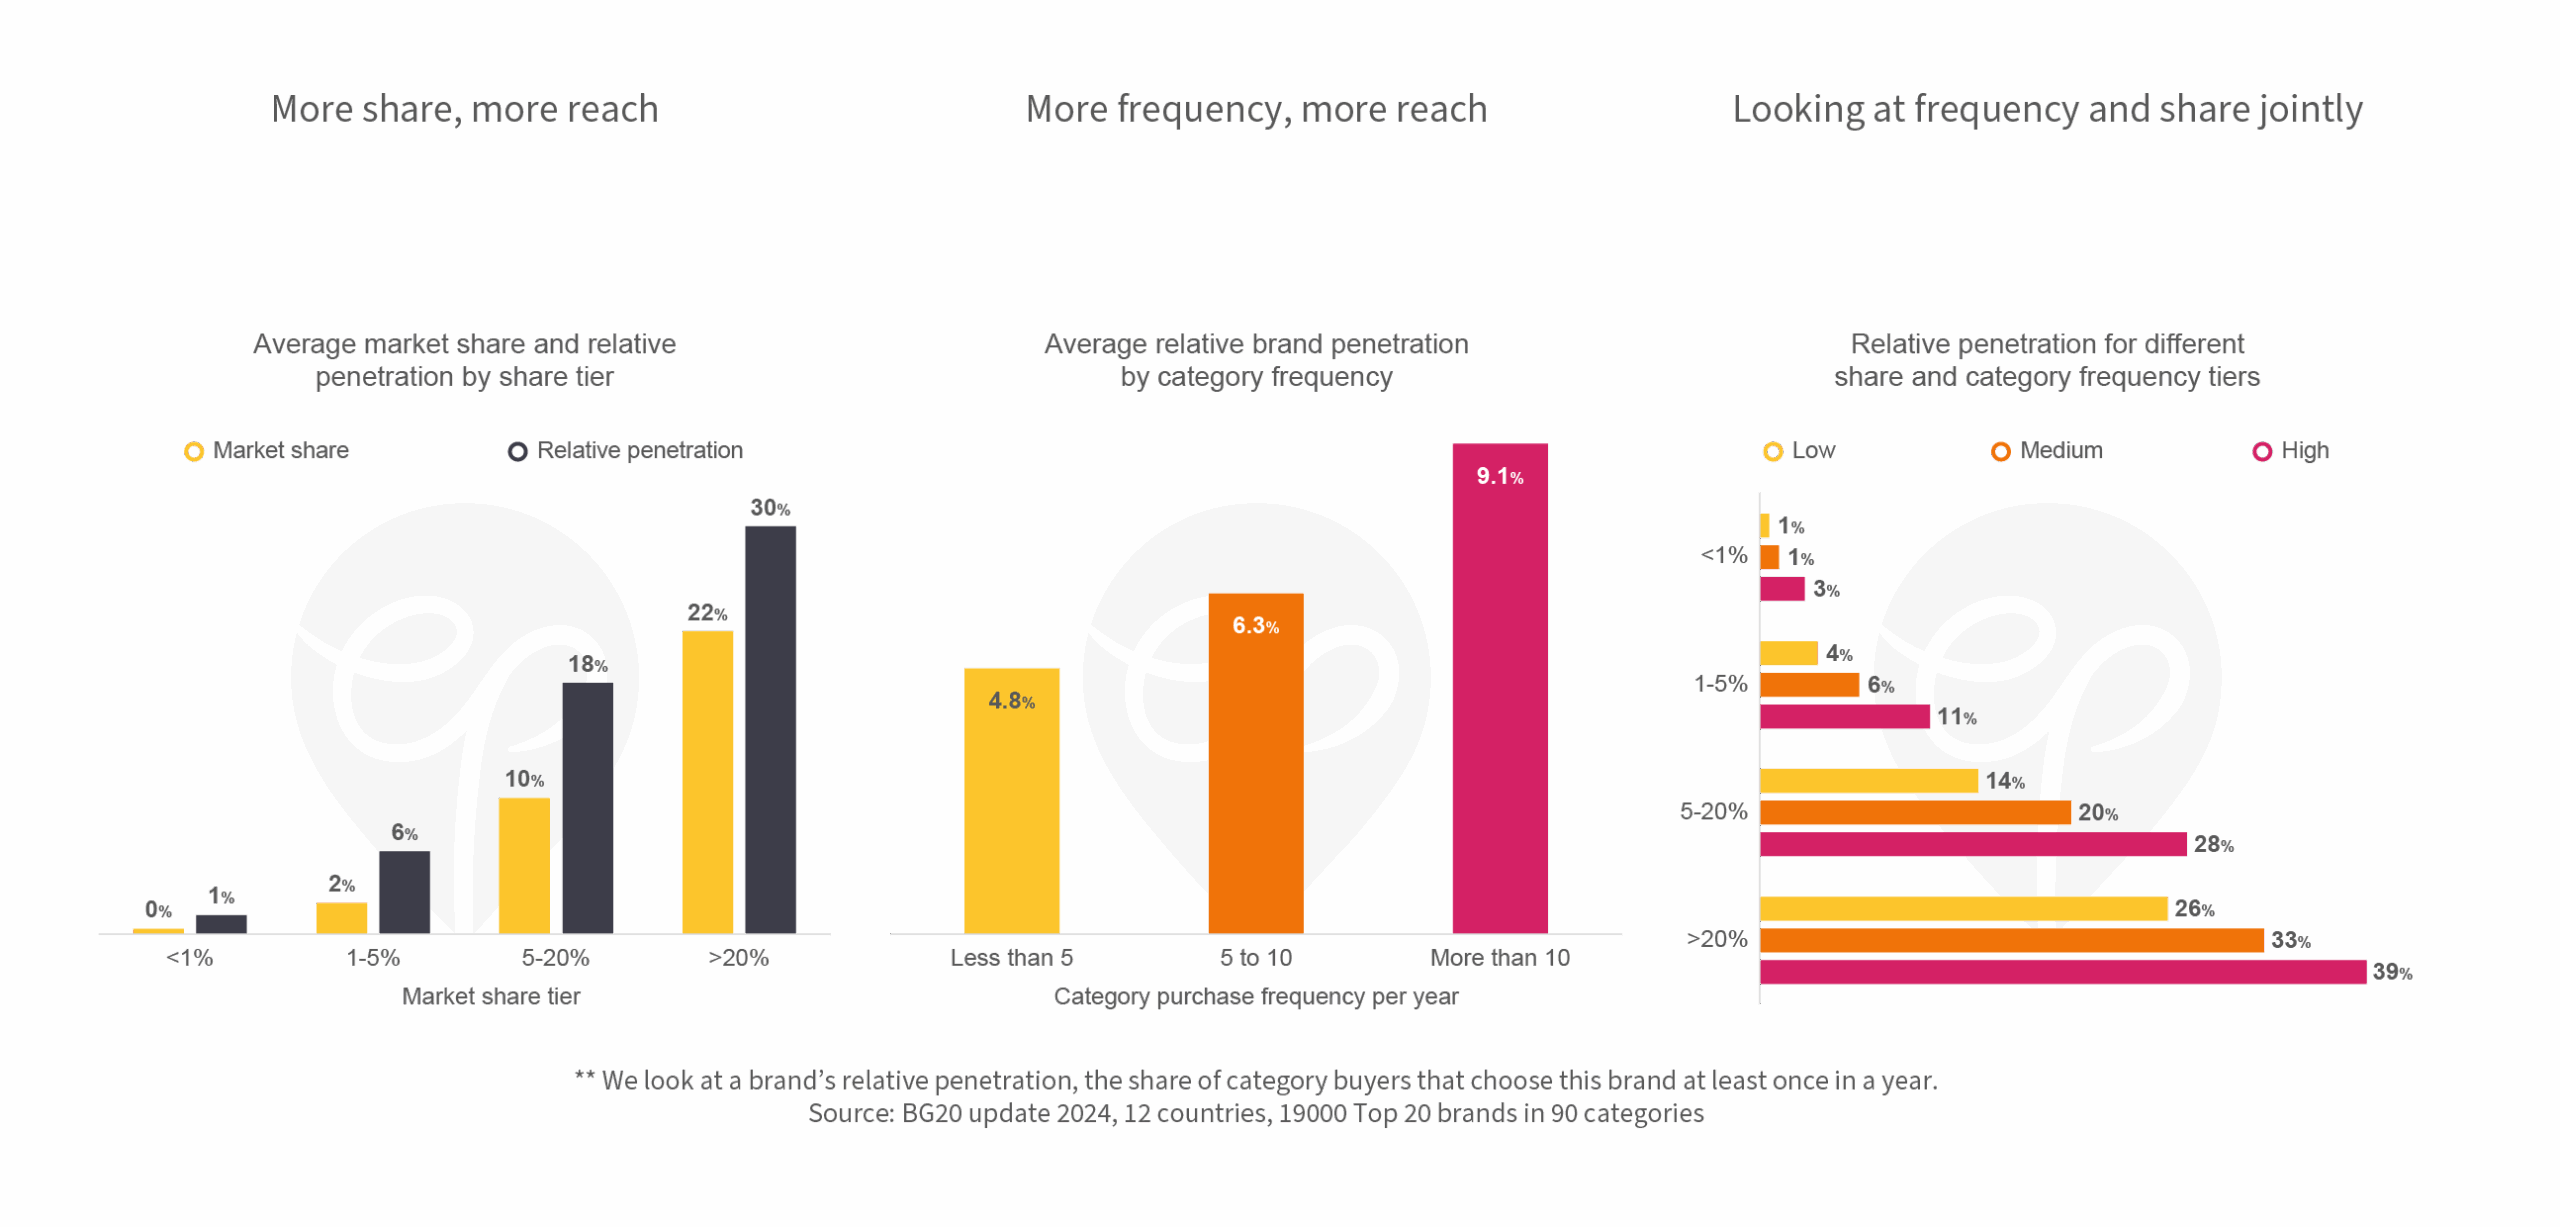
More share, more reach
This one may seem like a no-brainer: brands with higher market shares have more buyers. However, when comparing the largest and smallest tier in terms of share, we see that the difference in buyer numbers (index 19) lags behind the difference in share (index 64). Because large brands have higher purchase frequencies (Double Jeopardy) they attain a higher share contribution from each of their buyers.
More frequency, more reach
Brands competing in categories that are purchased more often can expect higher reach. The average Top 20 brand in categories with a yearly frequency of 10 or more attains relative penetration levels that are almost twice as high as brands should expect in less frequently purchased categories. What is also noteworthy: the average brand in the lowest frequency tier commands a higher market share (3.7% vs 2.6% in the highest frequency tier) because these categories attract less competition (both branded and PL).
Looking at frequency and share together
The strong link between share and reach holds for all frequency tiers. The reach disparity is relatively more pronounced in infrequently purchased categories where reaching buyers is harder due to fewer opportunities. Small brands in such categories must make every attempt to be available when one of these opportunities arises (we will take a closer look at the role of retailer presence next week). Managers should consider category frequency and the size of their brands when setting goals regarding brand reach.