Price levels and promotional intensity: a comparison over ten years
In a majority of countries promotion levels are slightly below their 2014 levels, prices paid obviously are much higher
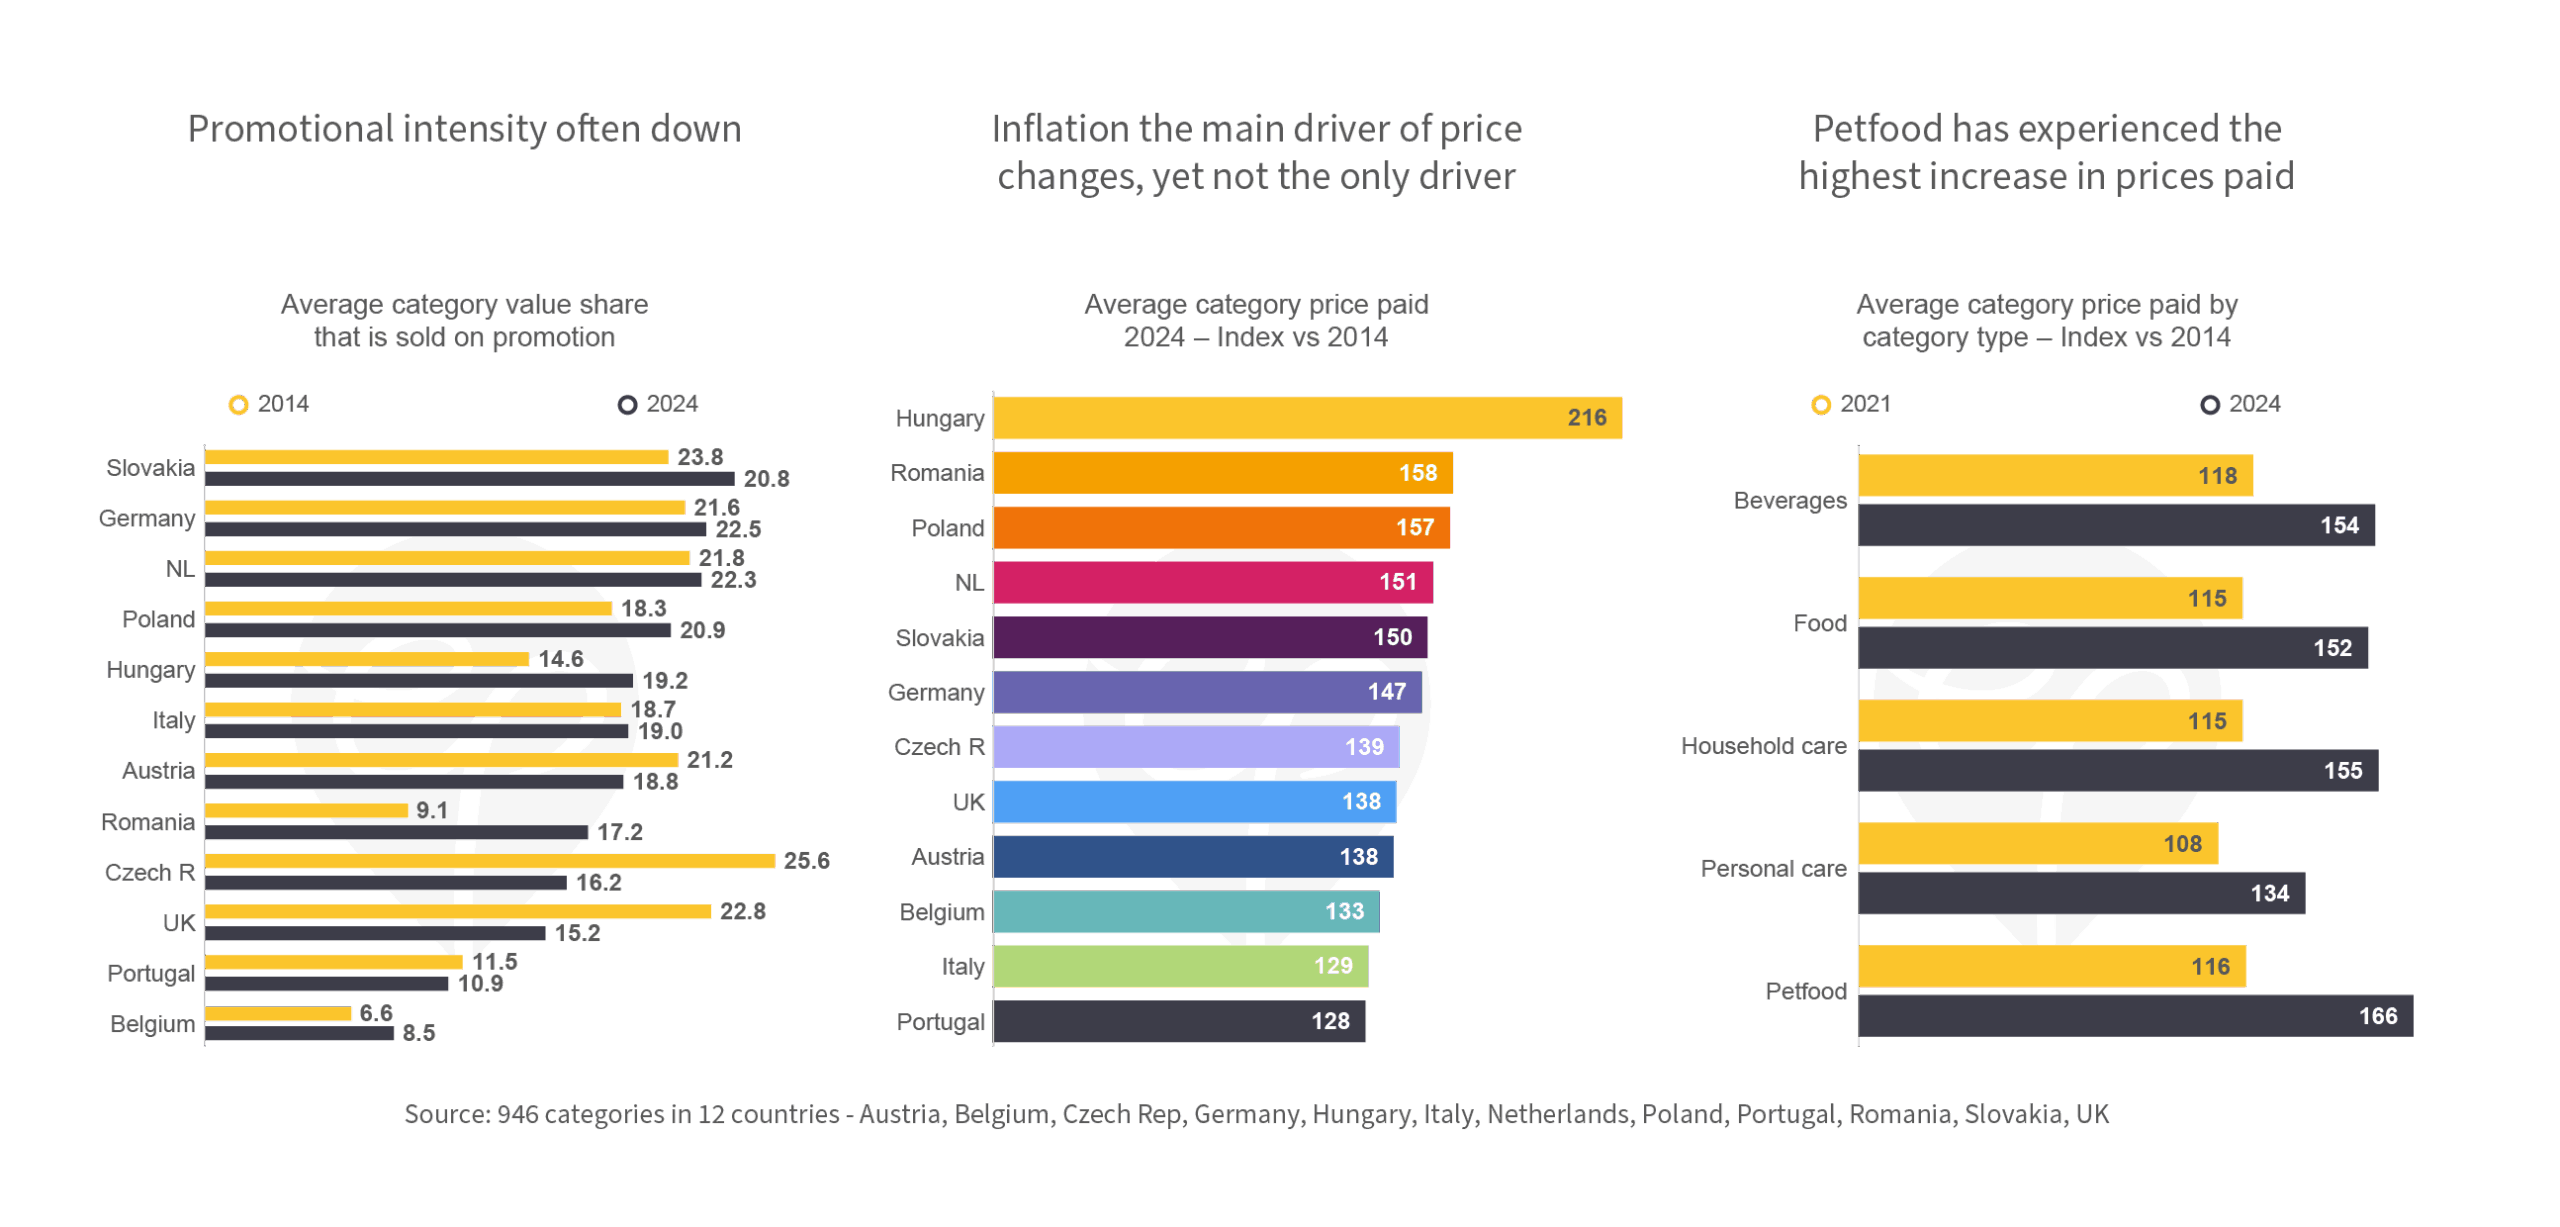
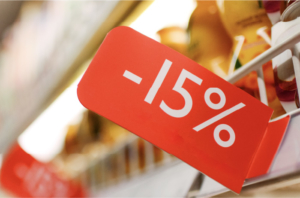
Promotional intensity often down
Comparing the value that is sold on promotion in the average category shows some noteworthy changes over the past ten years: quite substantial decreases in the UK or Czechia, increases in Romania, Slovakia or Hungary. In a majority of countries the change is less than 3%. Again, these averages hide a lot of variation between categories: do you know how your categories are moving?
Inflation the main driver of price changes, yet not the only driver
In a majority of European countries the average price paid across some 80 categories is between 30 and 50% higher than in 2014. Almost 80% of that increase happened over the past four years. But inflation is not the only factor impacting paid prices. Where consumers turn to private labels and discounters or downtrade to lower priced brands (often as a reaction to inflation) prices paid increase less.
Petfood has experienced the highest increase in prices paid
Trends in prices paid over the past ten years have been quite consistent across category types. On average, personal care has experienced the least increase (+34% over ten years) while petfood has seen paid prices increase most. Do you know what your category’s trajectory looks like in the long run – and how much of the change is due to inflation versus up/downtrading? Do you know what your brand’s trajectory looks like in the long run and how these changes have affected your share?