Purchase frequency and brand numbers have increased lately
Another look at long-term changes in shopping behaviors
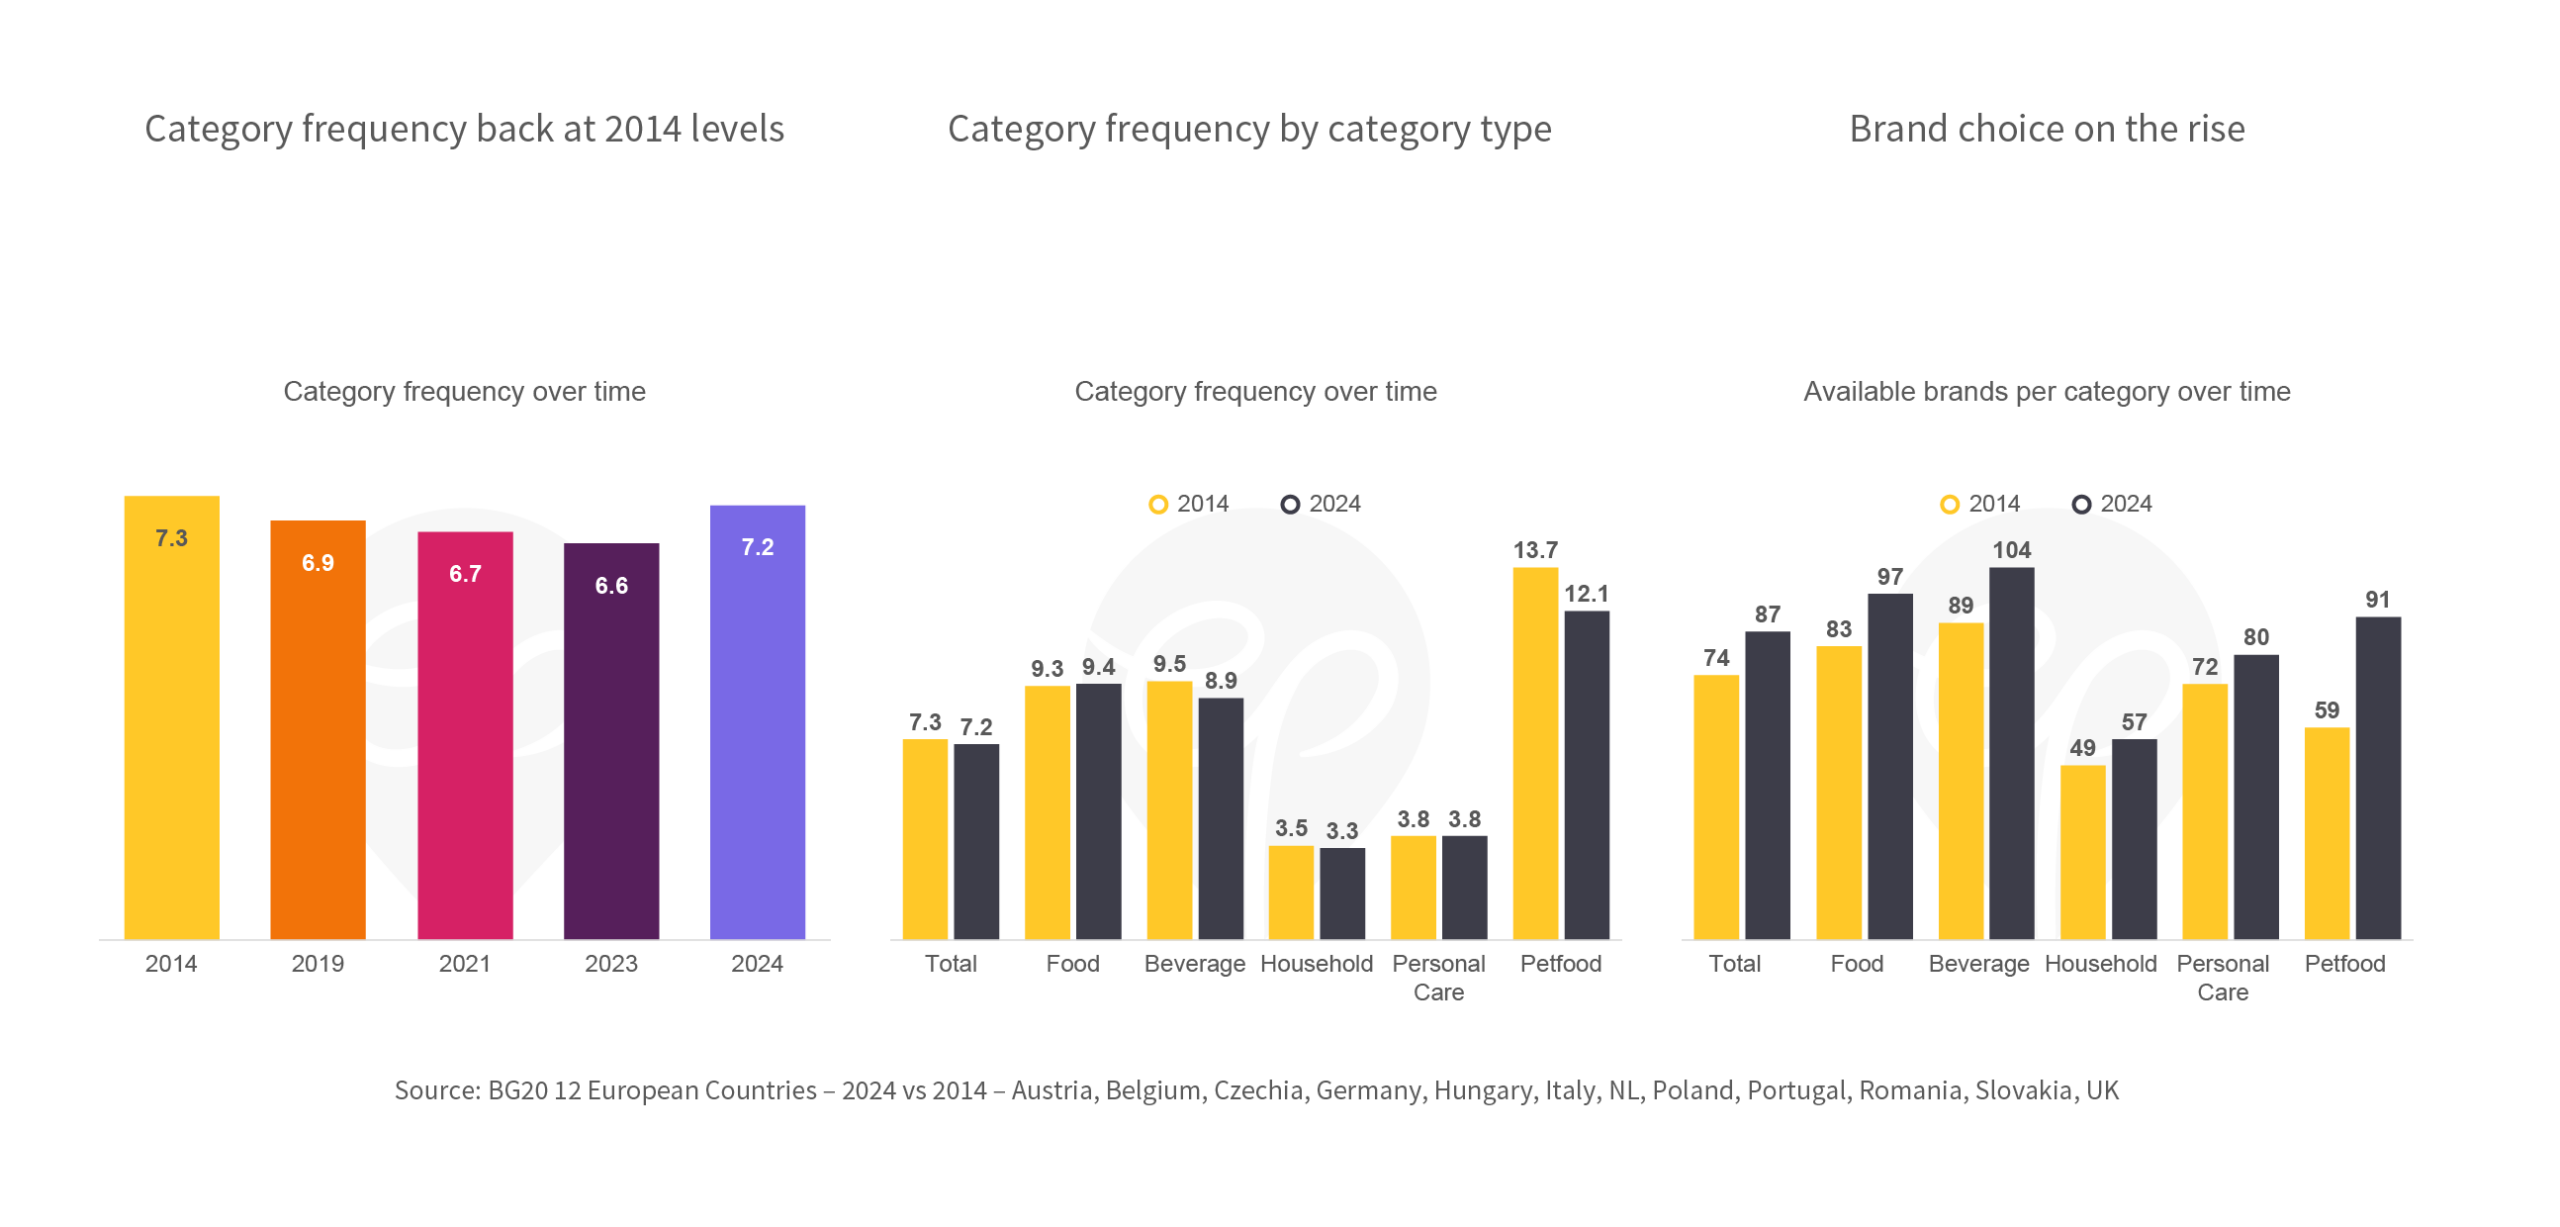
Category frequency back at 2014 levels
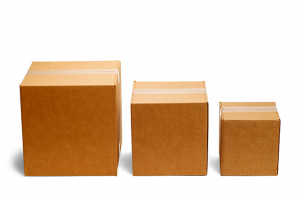
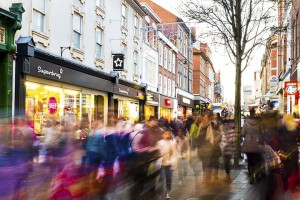
From 2014 to 2023 we see shopping occasions in the average category decline by about ten percent. From 2023 to 2024 this drop has been reversed – likely a sign of declining confidence reducing basket size in the average category leading to more frequent shopping trips.
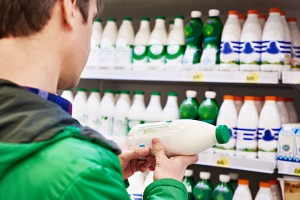
Category frequency by category type
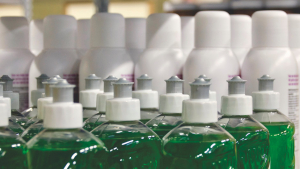
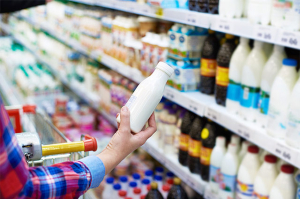
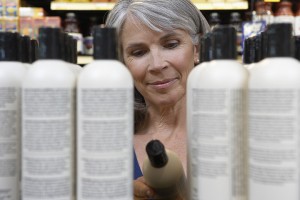
From 2014 to 2024 trip numbers have fallen in all category types except Food and Personal Care. Pet owners are shopping food for their loved ones most frequently, while shopping occasions in Household and Personal Care categories are less frequent than once per quarter.
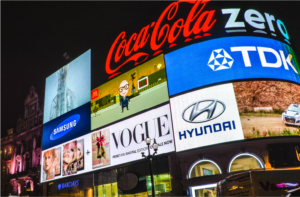
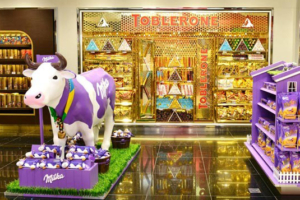
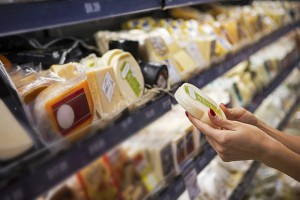
Brand choice on the rise
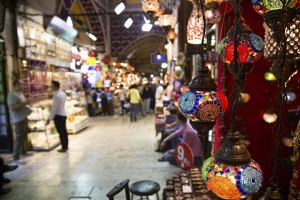
In spite of share gains by Private Labels, the number of brands shoppers can choose from has increased by almost 20% in the average category. We saw last week that the aggregated share of non-top 10 brands has remained stable over time, but this share is now spread across more brands. Therefore, the average non-top 10 brand has experienced a share decline – just like its larger peers.