Share of category leaders down over ten years
On average 2% of market share lost
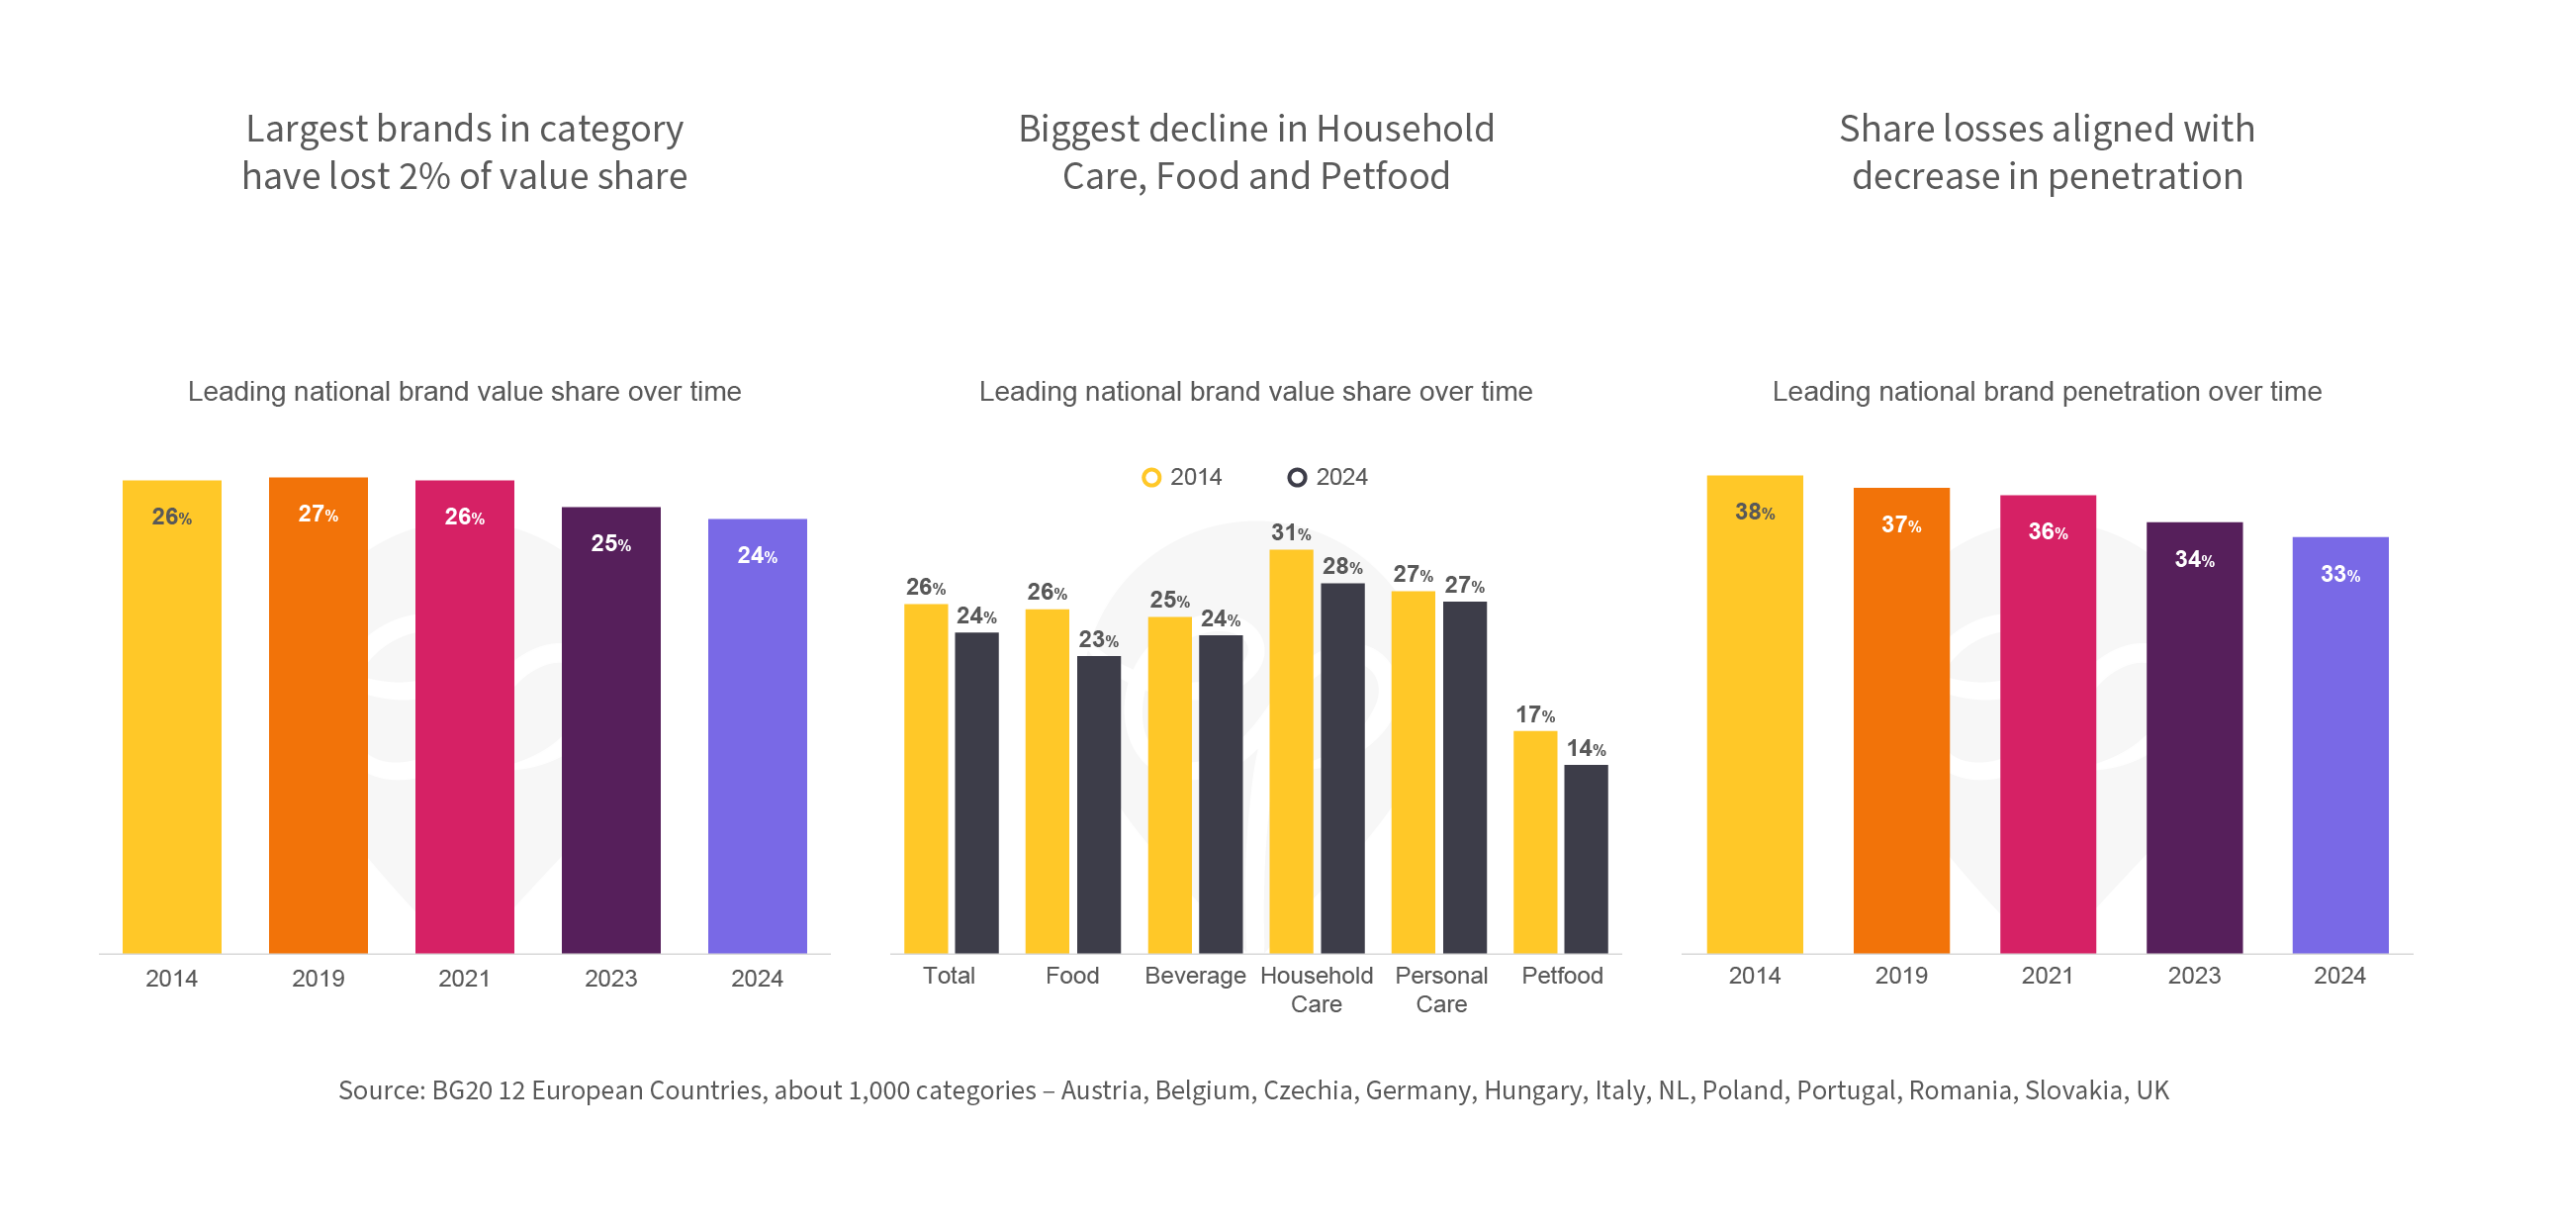
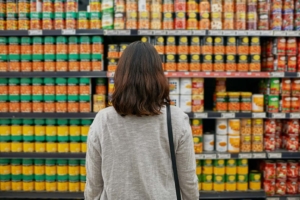
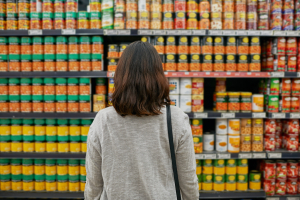
Largest brands in category have lost 2% of value share
From 2014 to 2024 the average value market share of category-leading national brands (note that the actual brand leading the category may have changed) has dropped from 26% to 24%. They did better between 2014 and 2019, a time period when Private Labels were growing relatively little, yet have lost about 10% of relative share (from 27% to 24%) since.
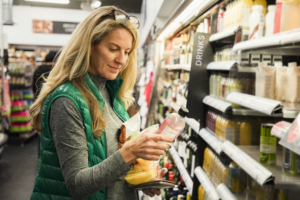
Biggest decline in Household Care, Food and Petfood
This pattern is similar when taking a more granular perspective: with the exception of Personal Care where the leading brand has not lost share over ten years, the average category leader has lost share, with the biggest drop in Food, Household Care and Petfood.
Share losses aligned with decrease in penetration
This decline aligns with substantial losses in penetration for the leading brand. While 38% of category buyers purchased the leading brand at least once in 2014, this number has gone down by 5% since. Next week we’ll take a closer look how much of these losses were poached by other brands and how much by Private Labels.