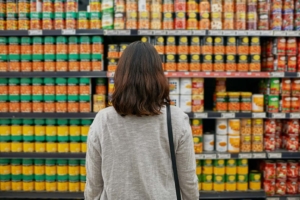
Category frequency rates stable over time – buyer reach a more promising path to growth
Over 10 years, it is uncommon for category buying frequency to change by more than 1 occasion per year
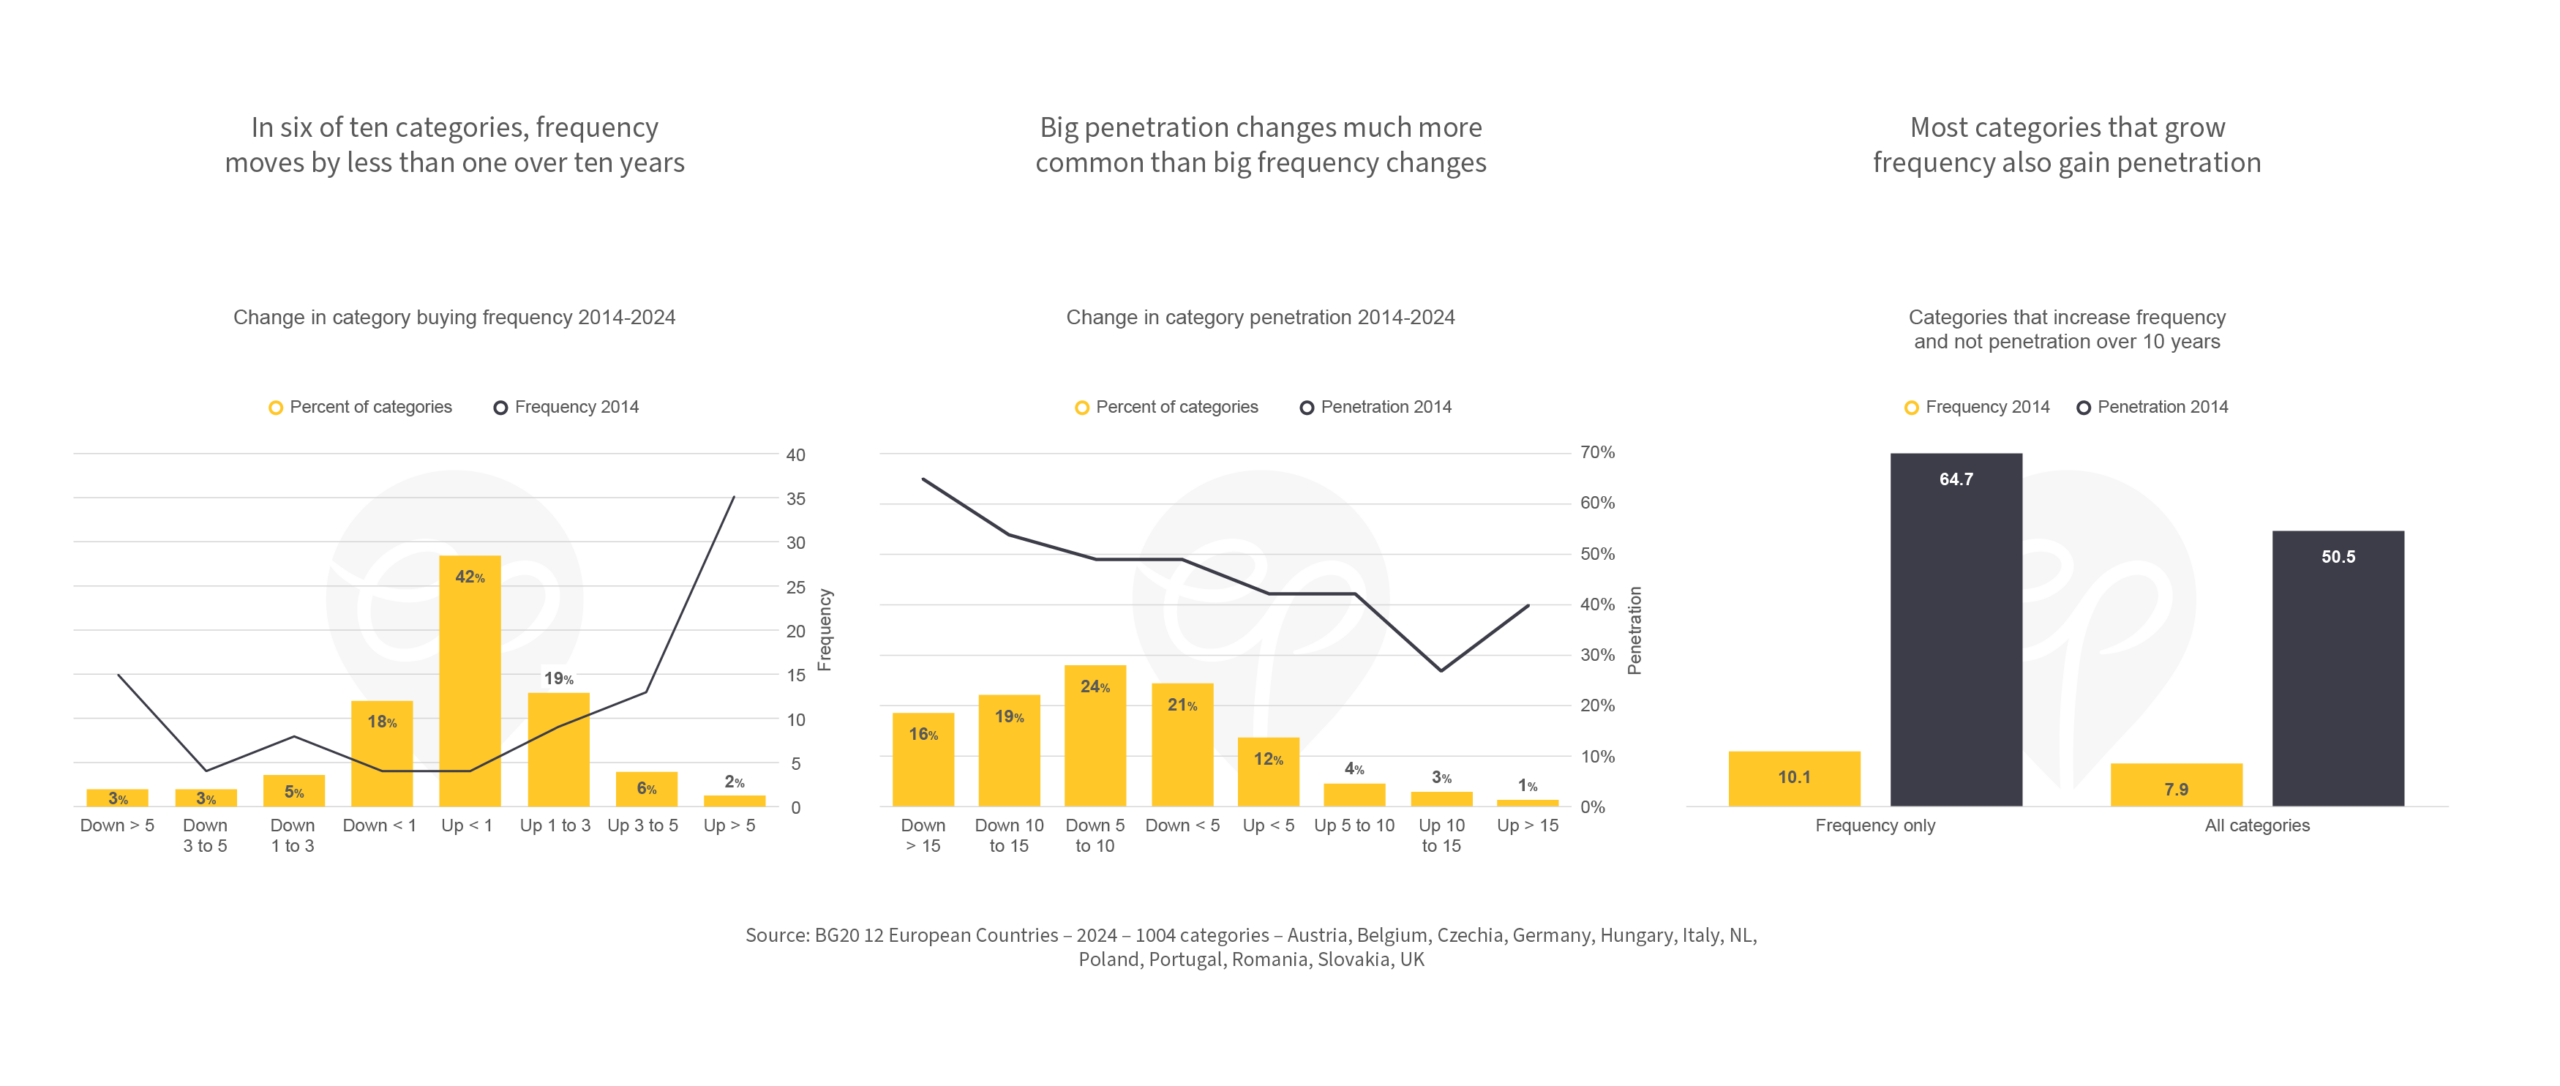
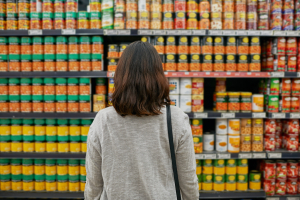
In six of ten categories, frequency moves by less than one over ten years
From 2014 to 2024 average category purchase frequency changed by less than one occasion. Amongst the most stable categories, an increase in purchase frequency was twice as common as a decrease. Larger changes are associated with categories that were more frequently purchased in 2014 – both among categories strongly declining and strongly increasing in frequency.
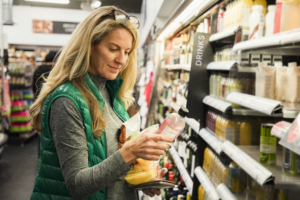
Big penetration changes much more common than big frequency changes
Big changes in category penetration are much more common than frequency changes – and more often penetration is down than up. In two of three categories penetration has changed by more than 5% over ten years. So buyer numbers do move and think about what you can do about it. Penetration declined in more widely purchased categories and increased in less penetrated categories (a “regression to the mean”).
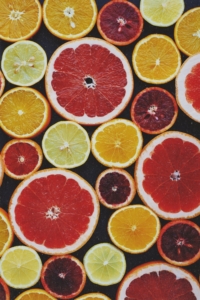
Most categories that grow frequency also gain penetration
Only 26% of categories that show an above-average increase in frequency over 10 years do so without gaining more buyers. So frequency gains are typically a result of an increasing buyer base at all frequency levels (i.e. more 1,2,3 … time buyers). Above average frequency growth without a corresponding growth in penetration is typical of categories that are already large and already frequently purchased.